
At the beginning of sec. XX (1933) Fletcher and Munson carried out a very important study and verified that what the human being does not respond equally to different frequencies.
With the electronic capacity already existing at that time, they were able to produce sound in a loudspeaker at different frequencies (lower and more treble sounds), they were able to adjust the respective intensity and know, in decibels (dB), the intensity of each signal.
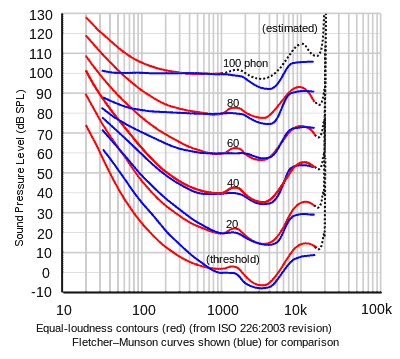
Fletcher and Munson selected the frequency of 1000 Hz as a reference and gave a group of students 100 dB to 1000 Hz to hear. Then they gave a sound to be heard at 100Hz and asked the students to adjust the intensity of that sound until it sounded to them with the same intensity as the 1000Hz sound.
They found that in physical terms (in dB) it was necessary that the sound at 100 Hz had more physical intensity (higher value in dB) to sound equal to that at 100 dB at 1000 Hz. They did this experiment for various frequencies and for various intensities and thus obtained the first curves of equal intensity in history and created a new unit called a phon (phone), as shown in Figure 1.
Frequency Weighting
| 10 Hz | -70.4 | -38.2 | -14.3 |
| 12.5 Hz | -63.4 | -33.2 | -11.2 |
| 16 Hz | -56.7 | -28.5 | -8.5 |
| 20 Hz | -50.5 | -24.2 | -6.2 |
| 25 Hz | -44.7 | -20.4 | -4.4 |
| 31.5 Hz | -39.4 | -17.1 | -3 |
| 40 Hz | -34.6 | -14.2 | -2 |
| 50 Hz | -30.2 | -11.6 | -1.3 |
| 63 Hz | -26.2 | -9.3 | -0.8 |
| 80 Hz | -22.5 | -7.4 | -0.5 |
| 100 Hz | -19.1 | -5.6 | -0.3 |
| 125 Hz | -16.1 | -4.2 | -0.2 |
| 160 Hz | -13.4 | -3 | -0.1 |
| 200 Hz | -10.9 | -2 | 0 |
| 250 Hz | -8.6 | -1.2 | 0 |
| 315 Hz | -6.6 | -0.8 | 0 |
| 400 Hz | -4.8 | -0.5 | 0 |
| 500 Hz | -3.2 | -0.3 | 0 |
| 630 Hz | -1.9 | -0.1 | 0 |
| 800 Hz | -0.8 | 0 | 0 |
| 1 kHz | 0 | 0 | 0 |
| 1.25 kHz | 0.6 | 0 | 0 |
| 1.6 kHz | 1 | 0 | -0.1 |
| 2 kHz | 1.2 | -0.1 | -0.2 |
| 2.5 kHz | 1.3 | -0.2 | -0.3 |
| 3.15 kHz | 1.2 | -0.4 | -0.5 |
| 4 kHz | 1 | -0.7 | -0.8 |
| 5 kHz | 0.5 | -1.2 | -1.3 |
| 6.3 kHz | -0.1 | -1.9 | -2 |
| 8 kHz | -1.1 | -2.9 | -3 |
| 10 kHz | -2.5 | -4.3 | -4.4 |
| 12.5 kHz | -4.3 | -6.1 | -6.2 |
| 16 kHz | -6.6 | -8.4 | -8.5 |
| 20 kHz | -9.3 | -11.1 | -11.2 |
Comments are closed